Humanities New York first circulated its Cultural Field Survey in 2016, in order to complement other data sets important to the public humanities (these include Data Arts and the National Humanities Indicators). This year’s survey used both quantitative and qualitative questions to build on the previous year’s survey in order to help HNY better serve its grantees and program partners. A printable version can be found here.
Method
The survey data was collected in January and February of 2018 using data from 376 responses, with 208 complete and 168 partial (responses that were less than 50% completed were not tabulated). Respondents were drawn from the HNY database and a purchased list, with 95% of respondents having heard of HNY prior to taking the survey. In addition, most respondents are directors or senior staff of the cultural organizations they serve.
The respondents are museums, libraries, public schools, ethnic and cultural organizations, historical societies, community foundations, public media entities, arts councils, government agencies and statewide associations, as well as academic departments, research centers and programs within higher education.
Respondents were categorized by size:
Small Organizations typically have zero to five paid staff, a budget under $100,000, and 71% are located in upstate New York.
Medium Organizations typically have five to twenty paid staff, a budget from $100,001 to $1,000,000 and are located across New York State.
Large Organizations have more than twenty staff, a budget over $1,000,000 and are located primarily in New York City.
The Cultural Field Survey was not required of any participants and included a financial incentive (a $100 cash card raffle) for participants. Winners have since been announced on social media.
Findings
Several trends or stories emerged from the survey data that may be of interest even beyond the ways HNY might respond to them. For the purposes of analysis the survey results are broken down based on the size of the organization as noted above; this correlates strongly with budget size (.89) and upstate vs. downstate geography (.76). There are two main areas of focus in the survey: Audience and Programs.
Audience
This section looks at the strategies employed by cultural organizations to reach their intended audience.
Audience Outreach:
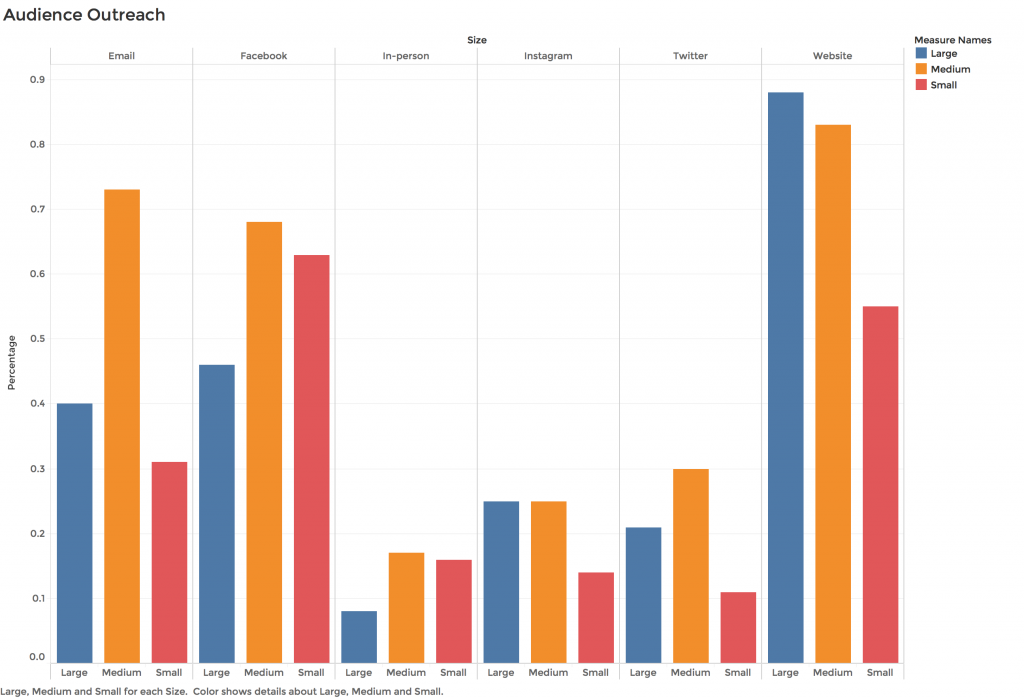
Cultural organizations use a wide variety of methods to publicize their work and offerings to their communities. Respondents were asked to rate the frequency with which they used different methods. The larger the organization, the more reliant they are on using the website to communicate with their audience. Medium-sized organizations represent the most diverse mix of engagement methods, perhaps owing to a combination of higher capacity than smaller organizations but lower bureaucratic hurdles than larger organizations. The chart below shows the methods of engagement reported as being used most frequently.
Finding:
What smaller organizations lack in capacity, they make up for with more direct engagement. Medium-sized organizations strike a balance. Large organizations rely on their audience coming to them.
Audience Engagement Methods and Diversity:
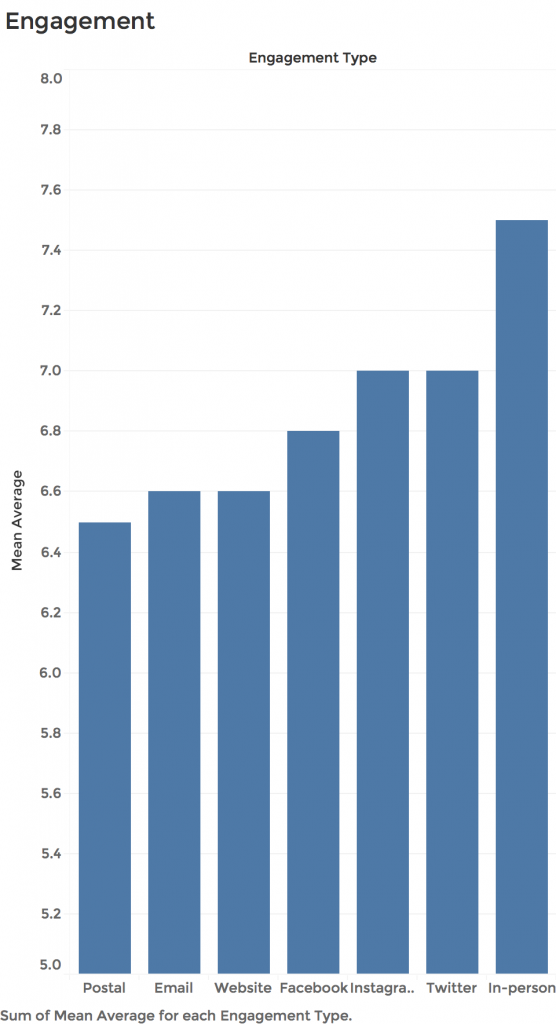
The more different methods an organization used to reach its audience, and the more frequently it did so, the more likely the organization was to self-report that their audience demographics reflected those of the region they work in. The average of the means for diversity representation for all groups was 6.6 on a scale of 1-10, with 10 being completely representative. Groups that focused on in-person engagement and newer forms of social media reported having significantly higher means (See table below).
Finding:
There is no substitution for in-person audience engagement.
Demographics Collected
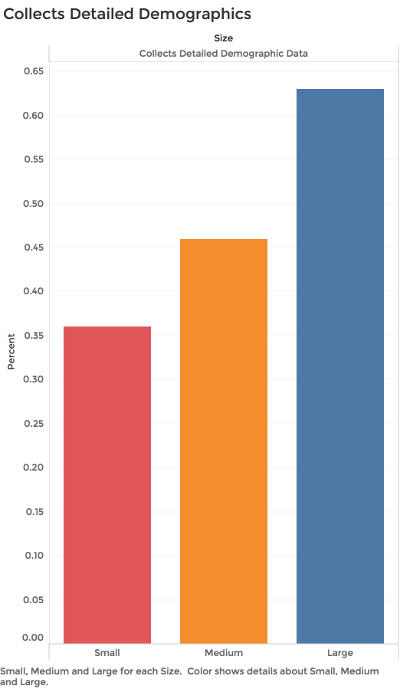
Organizations were asked about the amount of demographic data collected. While almost all organizations do collect some demographic data, the quantity and depth of data collected varies considerably based on the size of the organization.
Finding
The larger the organization, the more demographic data is collected. This is important since demographic data informs how audiences are served.
Programs
This section looks at interest in content and how it is evaluated.
Program Goals
Respondents were asked about the goal of their core programming in an open-ended format. Rather than the mission of the organization, this question was looking at what the measurable outcomes might be for humanities programs, given the different goals. The resulting answers were coded and from them eight different goals emerged, ranked below in order of frequency:
- Issue Awareness
- Education
- Community/Capacity Building
- Community Service/Resource Provider
- Entertainment/Public Programming
- Mentorship
- Professional Skill Development
- Dialogues / Convening
Program Interest
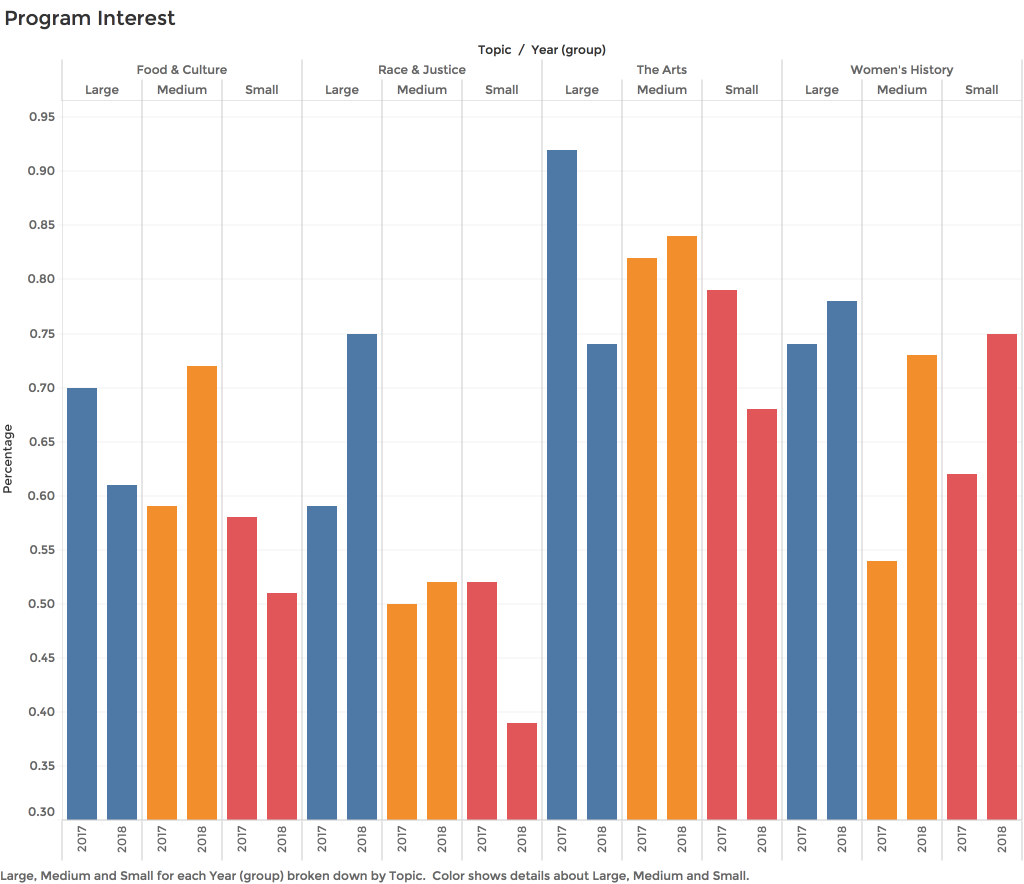
Respondents were asked to rate their interest in different program topics. Below is a breakdown of interest by organization and year for the four highest ranked program topics. The most striking change in program interest is reflected in Women’s History, no doubt a reflection of the NYS Women’s Suffrage Centennial of 2017 and the upcoming 2020 National Women’s Suffrage Centennial. Small-sized organizations showed a decreased interest in other programming options, but in examining the “other” category a strong interest in local history was reported that may correlate with women’s history. Medium-sized organizations showed a strong shift towards Food & Culture related programs in addition to Women’s History, with other interests reflecting the previous year. Large-sized organizations saw a decrease in The Arts (though still ranking them highest overall) and an increase in Race & Justice as themes. Larger organizations saw the smallest increase in Women’s History, but they had already been leading on the topic prior to the Centennial.
Finding
The NYS Women’s Suffrage Centennial had a strong effect on program at all organizations. It may have also contributed to a focus on local history at smaller organizations.
Program Evaluation
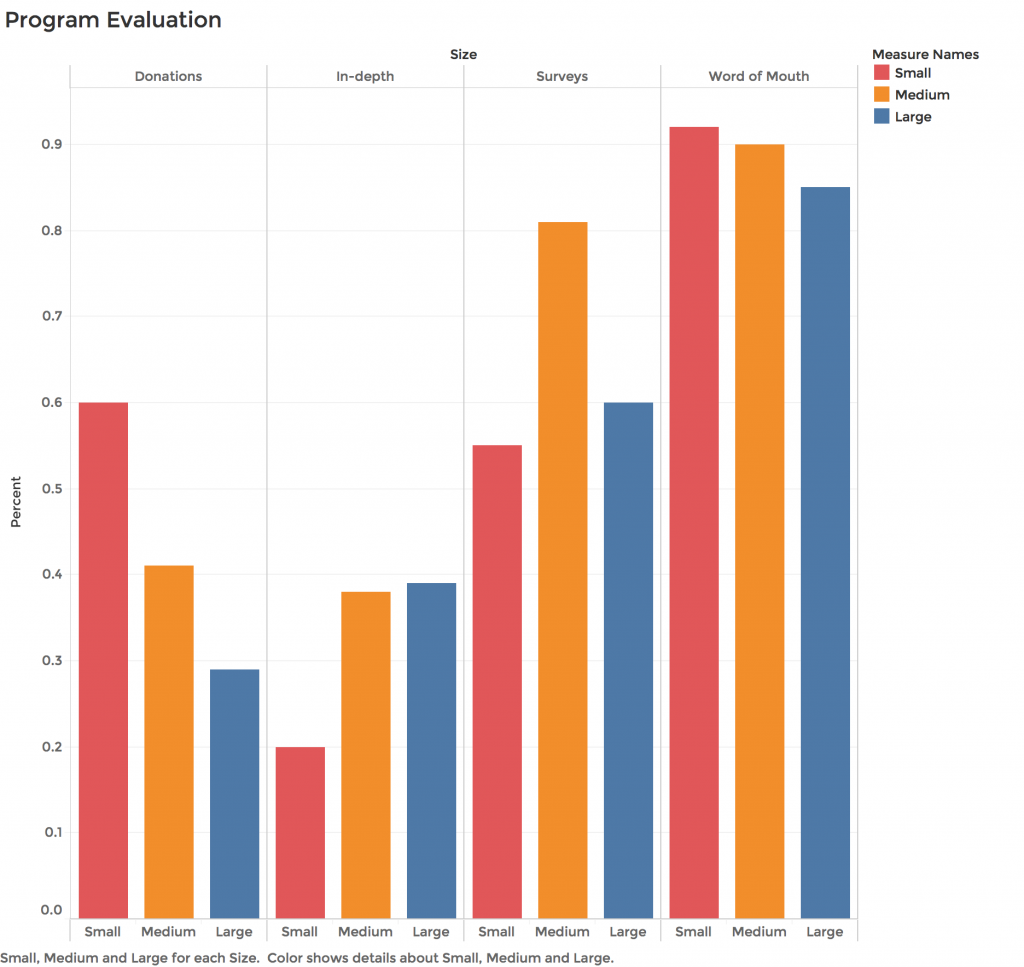
“Word of Mouth” is included by nearly all respondents as a metric for measuring the success of a given program, but other methods vary considerably. Most notably, size of the organization impacts how evaluation is done. It is most striking in the case of donations-as-feedback: small organizations measure success with them 60% of the time, medium 41%, and large 29%. This likely reflects the pressure that smaller organizations have for funding, one of the key difficulties identified by them in the survey.
Another trend among more formal tools is that the more complicated the tool the less often it is used; of the formal evaluation methods, surveys are the most common. Their usage is highest among medium-sized organizations at 81%, compared to 60% for small or large organizations. More detailed tools follow the scaling trend; only 20% of responding small organizations reported using them, while medium and larger organizations each report 38% usage.
Finding: The larger the organization, the less donations are used as the main measure of success and the more formal methods are used. Word of mouth and personal feedback matter to all respondents.
Barriers
Respondents were asked about what barriers, besides funding, they had to achieving their goals. The top mention for all organizations was transportation access; in most contexts these respondents were rural or in hard to reach locations. Smaller organizations typically mentioned barriers indirectly related to funding levels, such as staff and training. Medium-sized organizations were more concerned about reaching disabled communities, non-English speakers, and changing the perception of their organization (art organizations tended to mention the drawbacks to the arts being seen as associated with wealth or class). Larger organizations identified difficulty reaching minority and younger audiences.
Finding
Lack of adequate public transportation is a problem for all organizations; larger organizations may feel disconnected from some of the audiences they feel are important to serve and who would represent key growth.
Report prepared by Nicholas MacDonald, Communications Associate, Humanities New York
